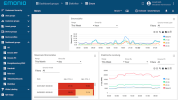
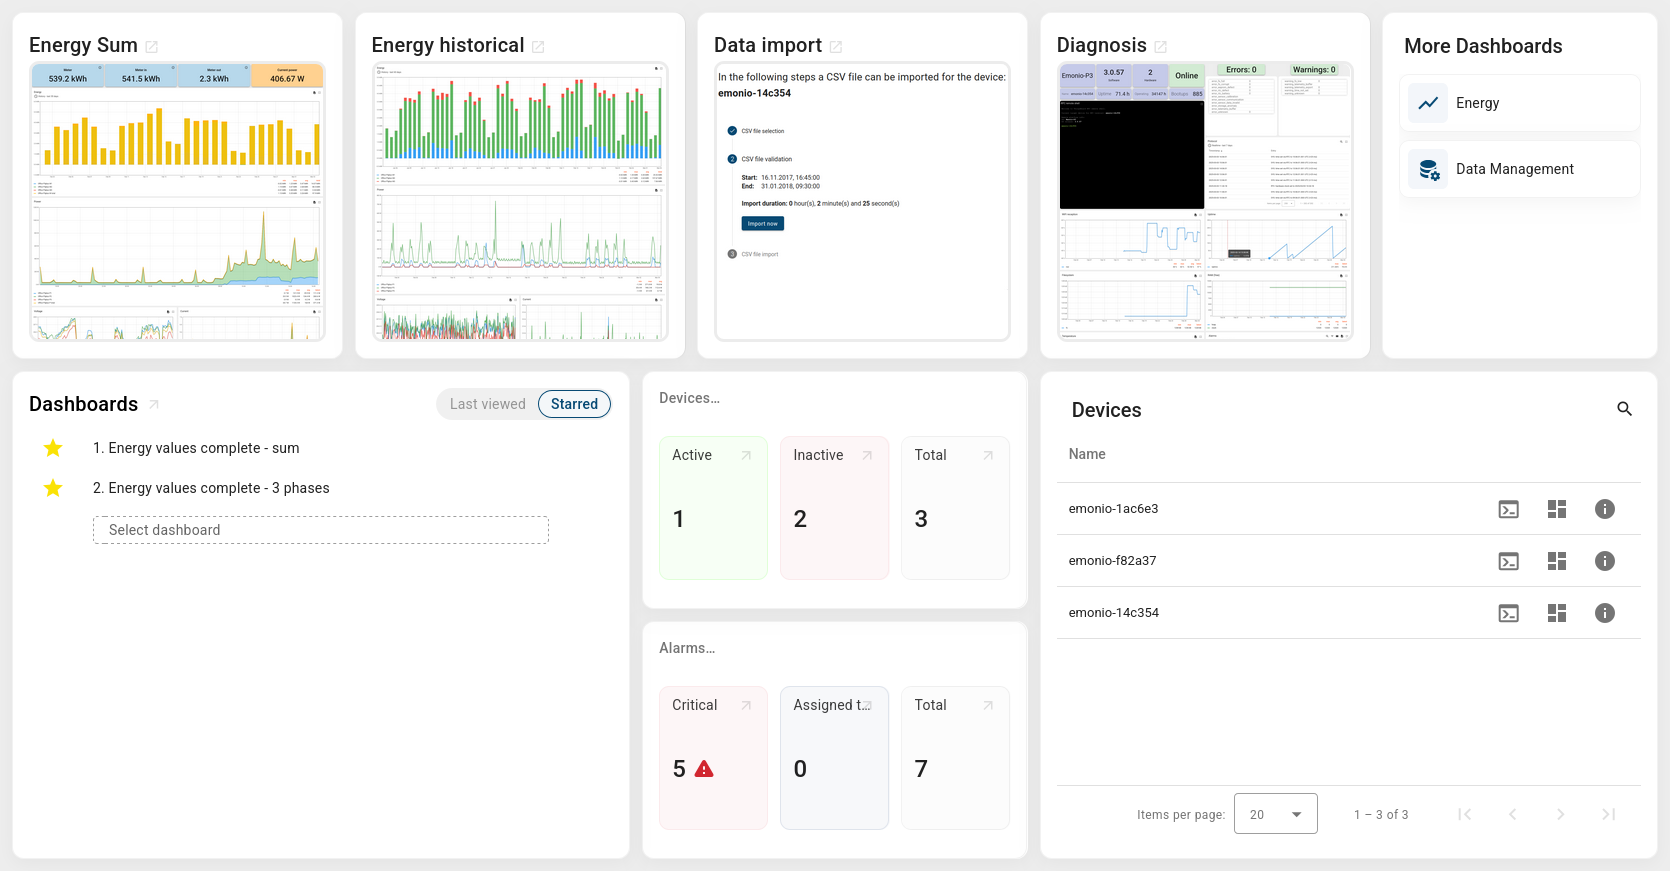
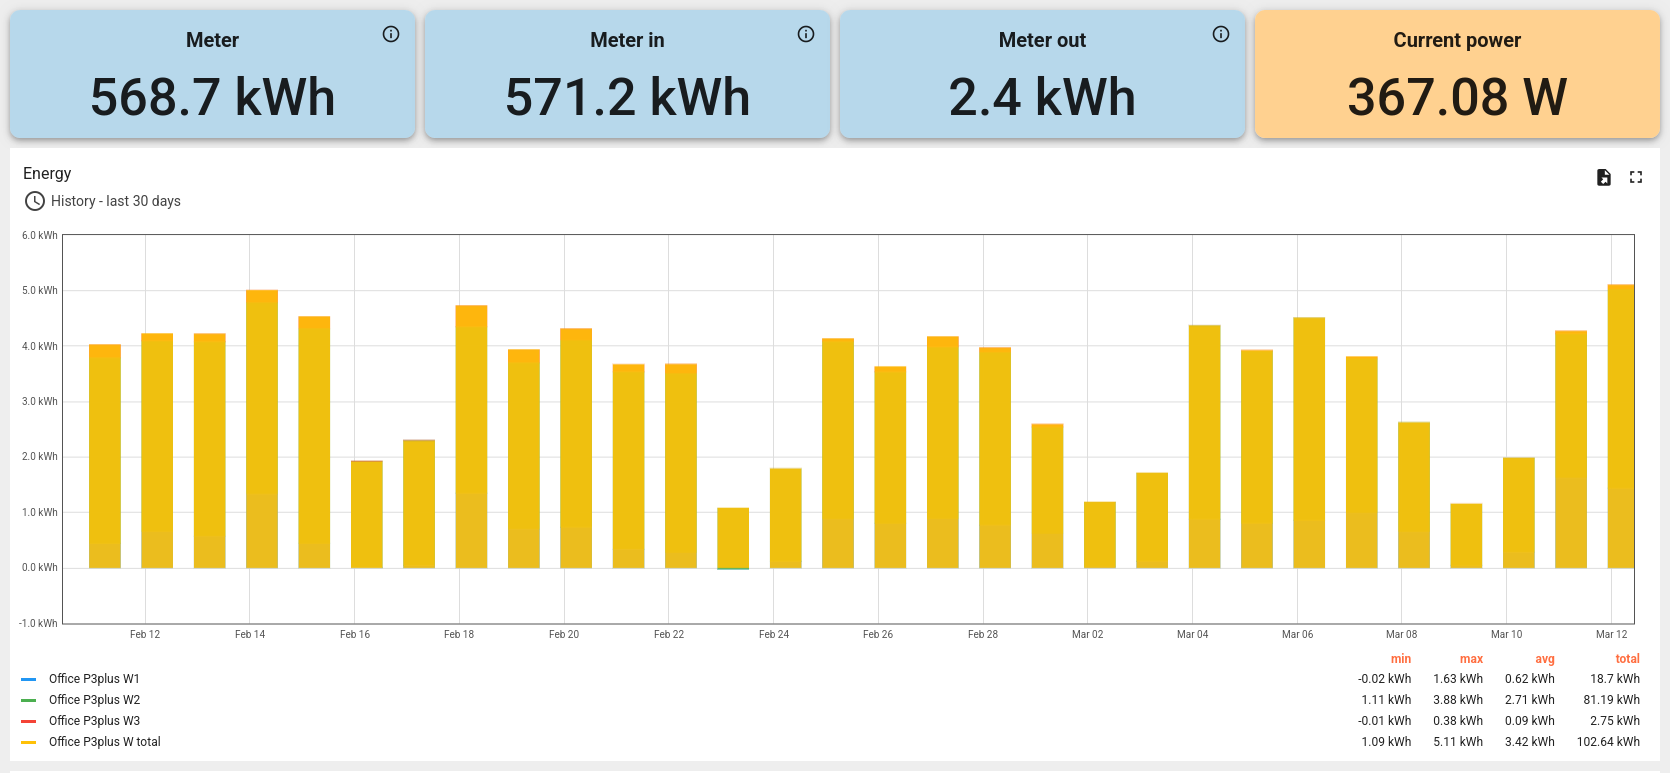
We have made some changes to our ProEmonio energy management software, primarily to improve the overview and accessibility of the most important functions. For this purpose, a new start page has been created, which is displayed after logging in and can also always be accessed via the "Home" entry in the navigation on the left-hand side.
Furthermore, adjustments have been made to the standard dashboards.
New Home page
The newly developed home page provides a simple overview of the most important functions and makes them accessible with just one click. This should make it easier for new customers in particular to get started with the platform, but experienced customers will also benefit from the improved overview.
Four of the most important dashboards are displayed at the top. From left to right, these are:
Various information and graphs for displaying diagnostic data are provided here. There is also the option of remote access to Emonios.
If the mouse pointer is positioned over the elements, a small info text is displayed and the corresponding dashboard is opened by clicking on it.
In the lower area, there is an overview of all dashboards on the left-hand side, where you can choose between "Last viewed" and "Starred". This means that dashboards you have created yourself can also be accessed quickly and listed clearly.
Information on active and inactive devices and alarms is located in the middle.
All devices are listed on the right and the list can be searched. The three icons can be used to open the Diagnosis dashboard, the Sum dashboard or the details page of the device.
New Home page
Updated dashboards
The Sum dashboard has a new meter reading display at the top. A new addition is the additional breakdown into energy received and energy fed into the grid. The display of the current power has been visually adapted to the new elements.
Meter readings in the new Sum dashboard
If "N/A" is displayed for the in/out meter readings, this means that the selected Emonio does not transmit the separate meter readings. This function has been supported since firmware version 3.0.64.
The same adjustment was made in the 3-phase dashboard. Here, of course, it is divided into the three individual phases.
Meter readings in the new 3-phase dashboard
The diagnostics dashboard has been significantly revised. The first change is the renaming of "LOG + RPC+ GPIO" to "Diagnosis". In the top left-hand area, there is now an overview of important information about the device, including the installed software version and the connection status. Errors and warnings are displayed to the right. There is also the RPC console for remote access to the device and a list of the last protocol messages from the device.
New Diagnosis dashboard
If you have any questions, requests or other comments, please contact us at support@emonio.de. We look forward to hearing from you.