Emonio Energy management Software

Analyse
Your Measured Data

In our analysis software pro.emonio, all your measured data is collected and graphically displayed. It doesn't matter how many Emonio P3 energy measuring devices you are using - by creating projects and assigning your power measuring devices to these projects, you always have an overview.

The analysis software pro.emonio.de includes:

  • Graphic display of high-resolution measurement data (e.g. on a second basis)
  • Quarter hour, daily, weekly, monthly and yearly values
  • Stepless selection of the displayed time interval (with zoom function)
  • Selection of different diagram types (bar, pie or line diagram) depending on the question
  • Representation of electrical current, voltage and power (reactive, active and apparent power)


  • Management of projects and user groups with individual read and write rights, e.g. for customers
  • Clear dashboard; with the help of widgets, various charts and chart types, it can be individually tailored to your needs
  • License includes updates, server usage and support

Data transmission locally or via internet

You can load the measured data on site as a CSV file onto your tablet or notebook or via the Internet directly into the analysis platform pro.emonio.de. The CSV data is available as a quarter-hour setting in the same format as the quarter-hour values from the energy supply companies for load profile customers. So you can process them as usual. And even with a power consumption of less than 100,000 kWh per year, you can reliably measure the energy consumption with the Emonio P3.

Software training

Our energy management software Pro.Emonio is funded by BAFA with up to 40%. Requirement: It is used as part of an energy management system in accordance with ISO 50001 and serves to continuously improve energy efficiency in the company.

Get to know our energy management software Pro.Emonio in a free 30-minute online introduction.

Click here for the next dates and to book.

Evaluate and analyze energy measurement data.
Here's how it works.

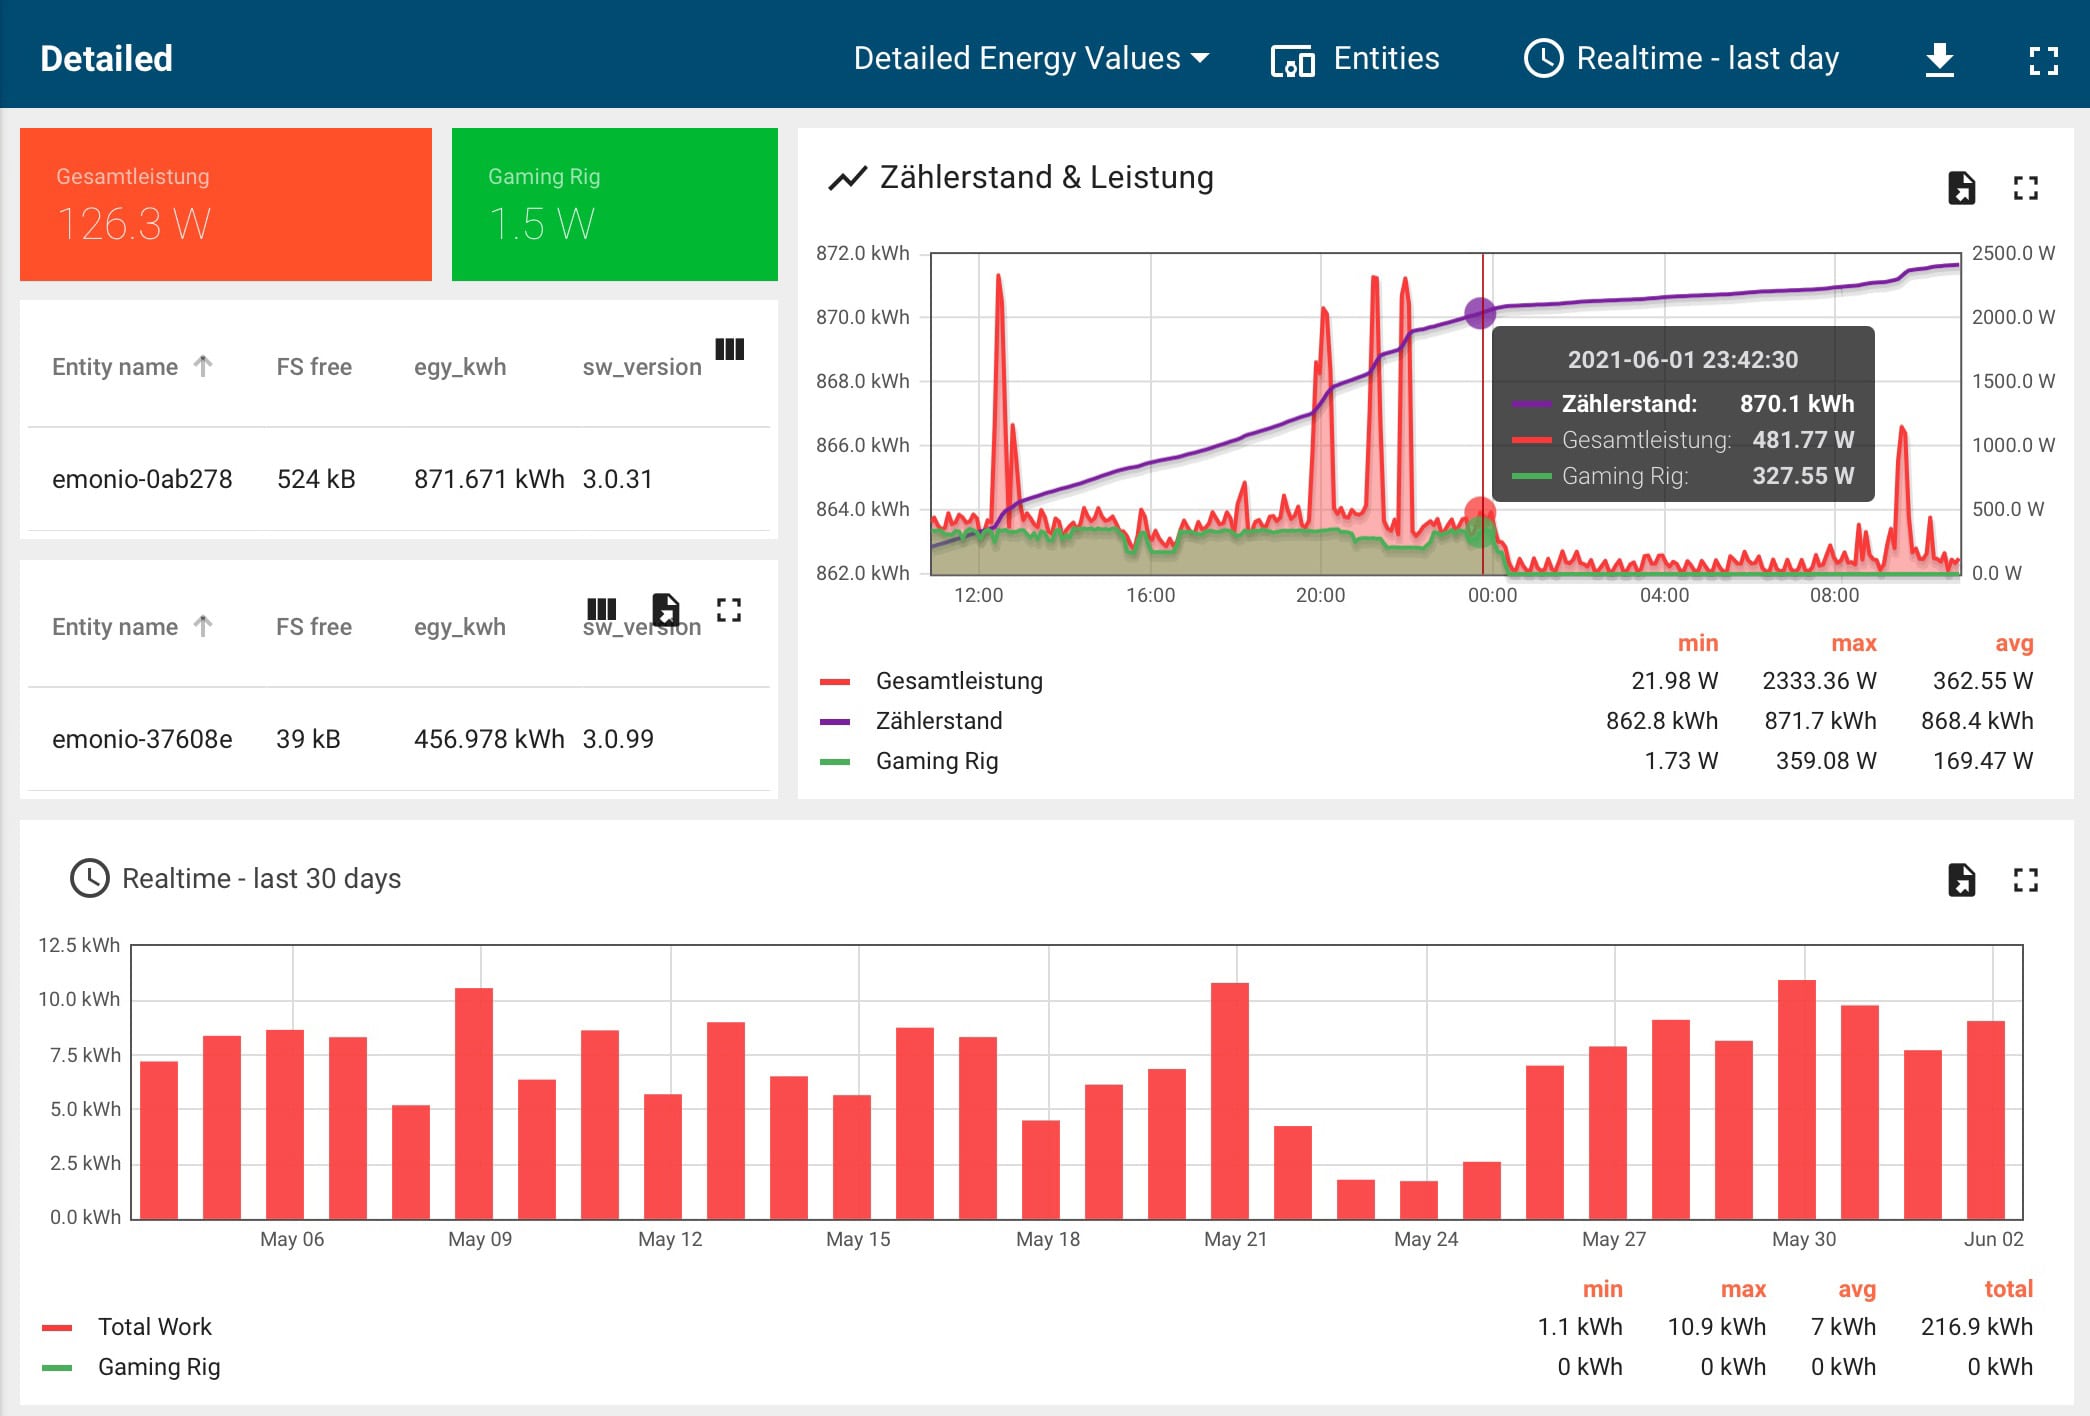
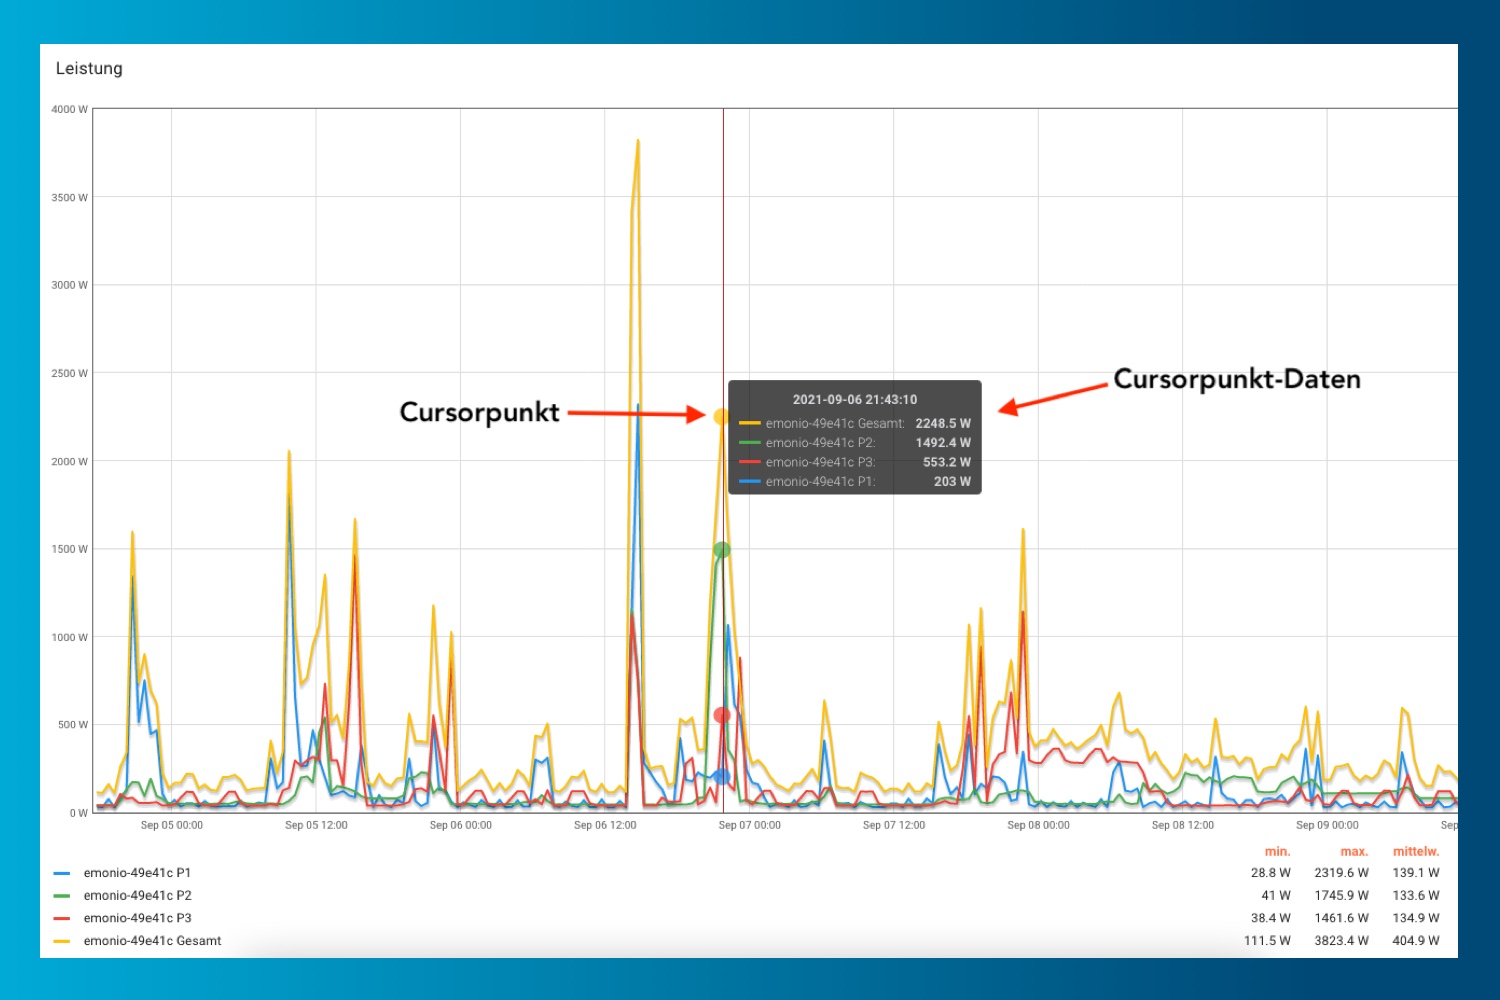
1/5 Read data points

Get your readings quickly and accurately with cursor point data retrieval.
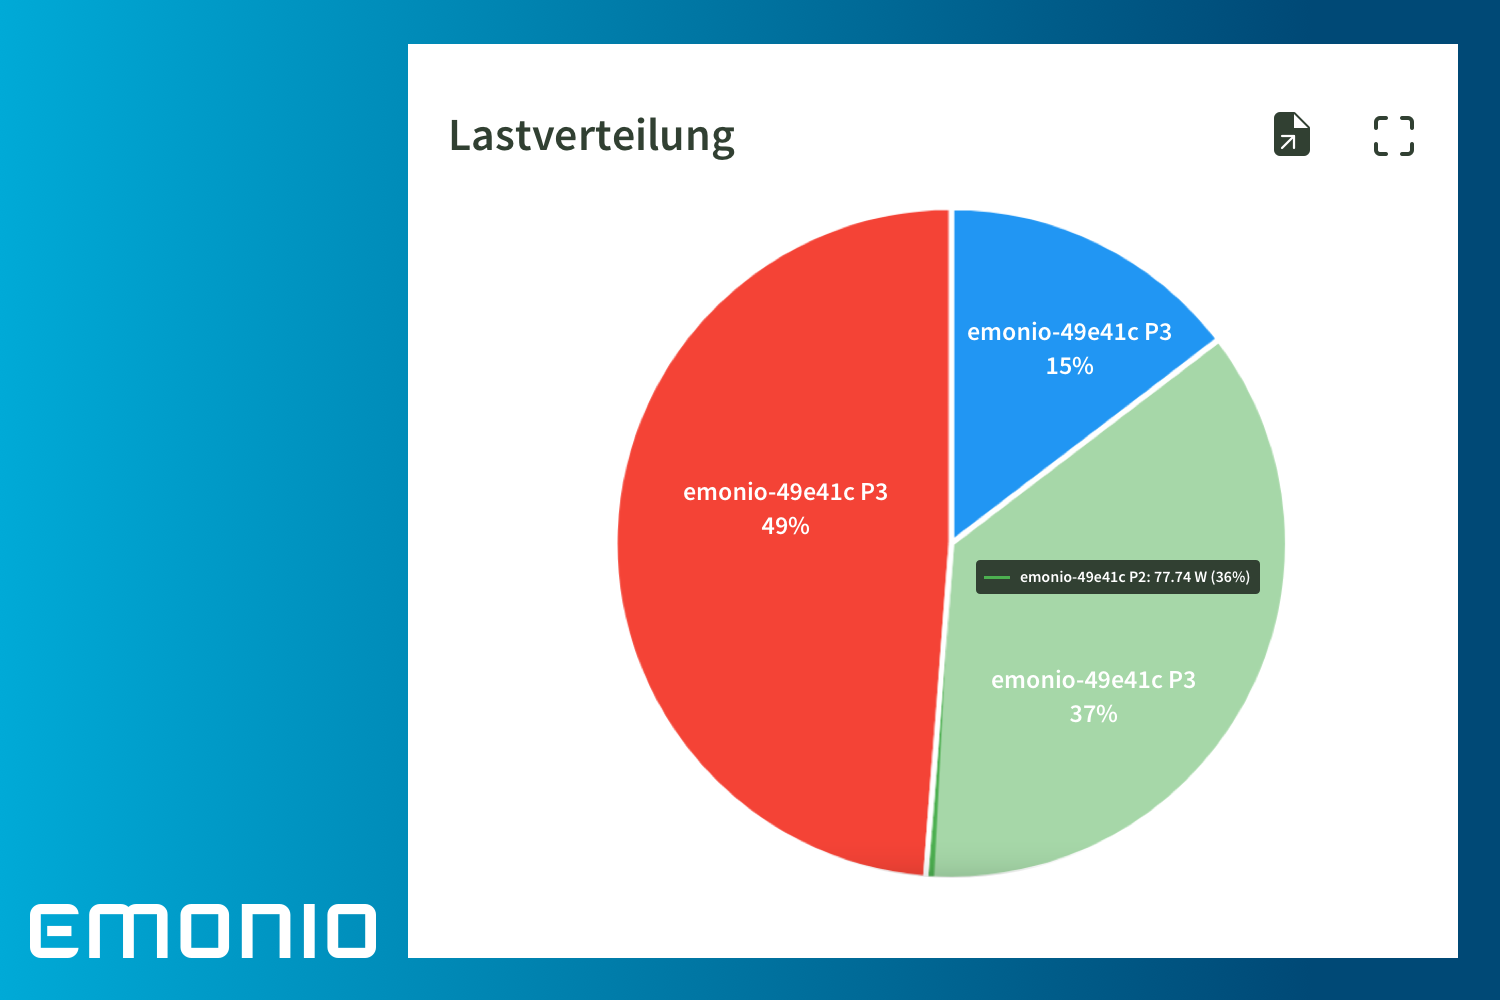
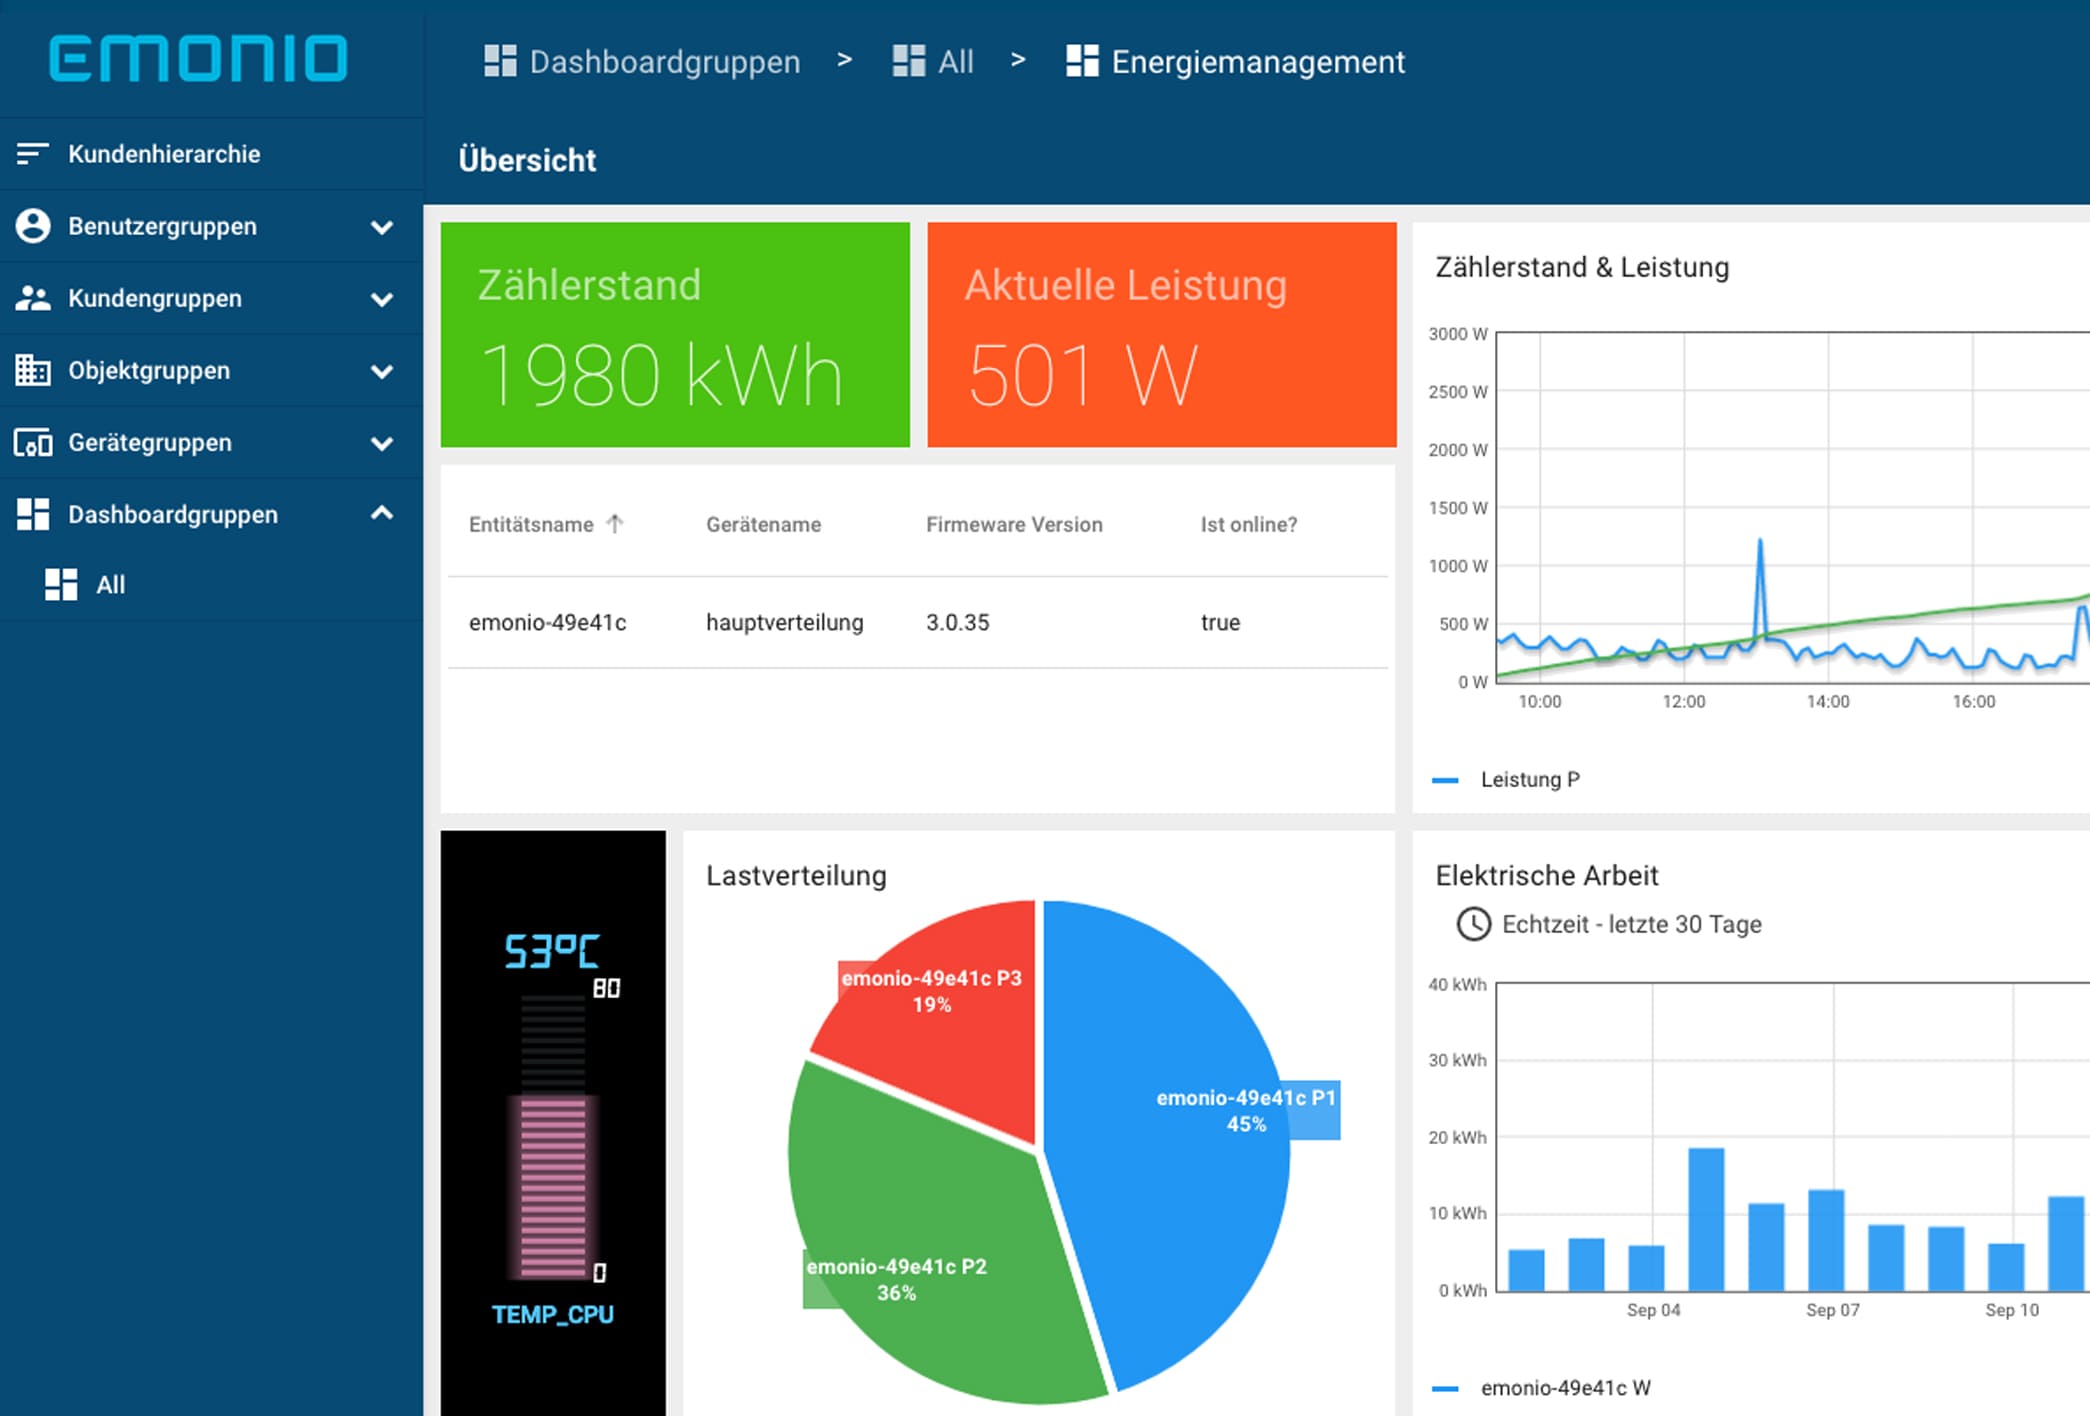
2/5 Create diagrams

Graphically display the load distribution of your 3-phase measurement.

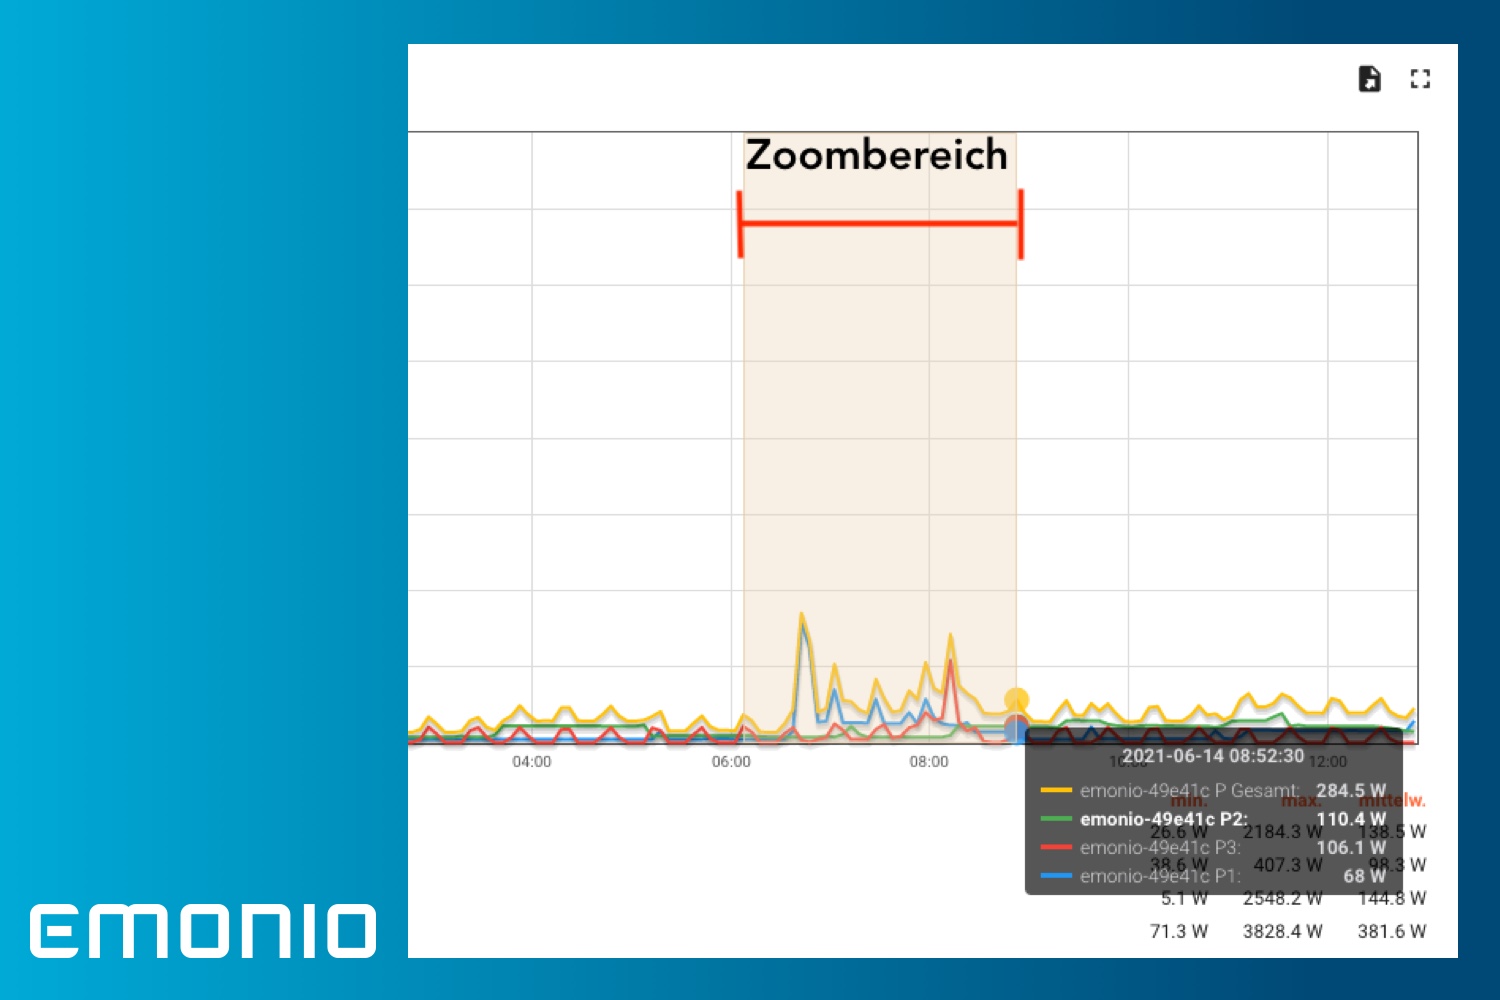
3/5 Use zoom function

WSimply use the mouse to select freely definable zoom areas, e.g. to take a closer look at extreme values.

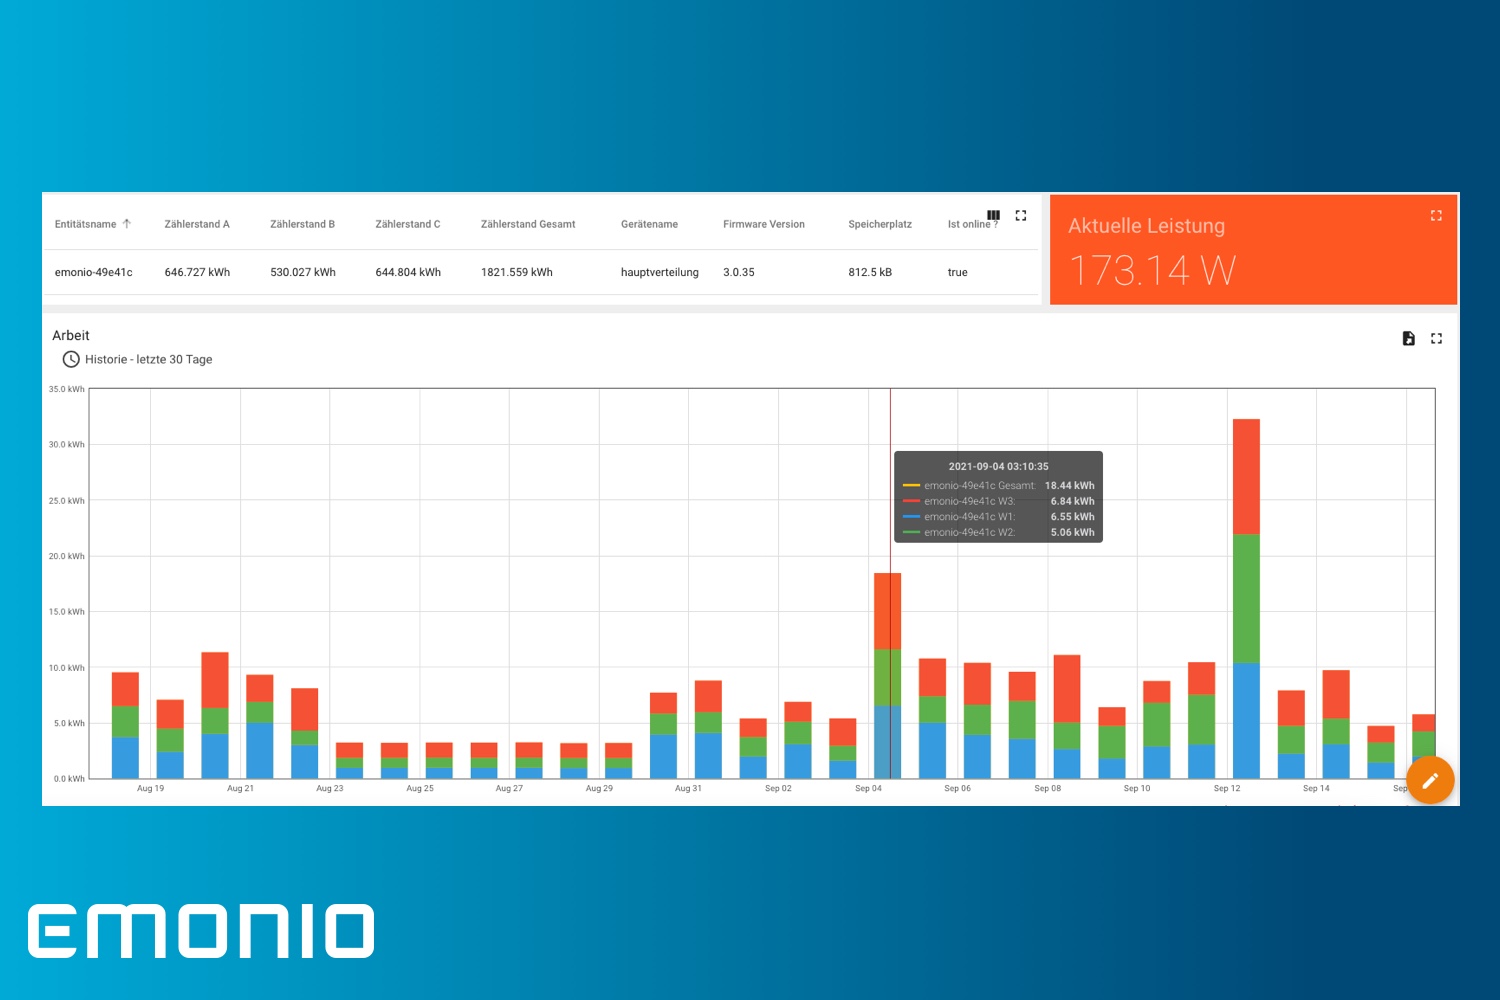
4/5 Create Dashboards

Create your individual dashboard. There are many different predefined elements (widgets) available for this purpose.

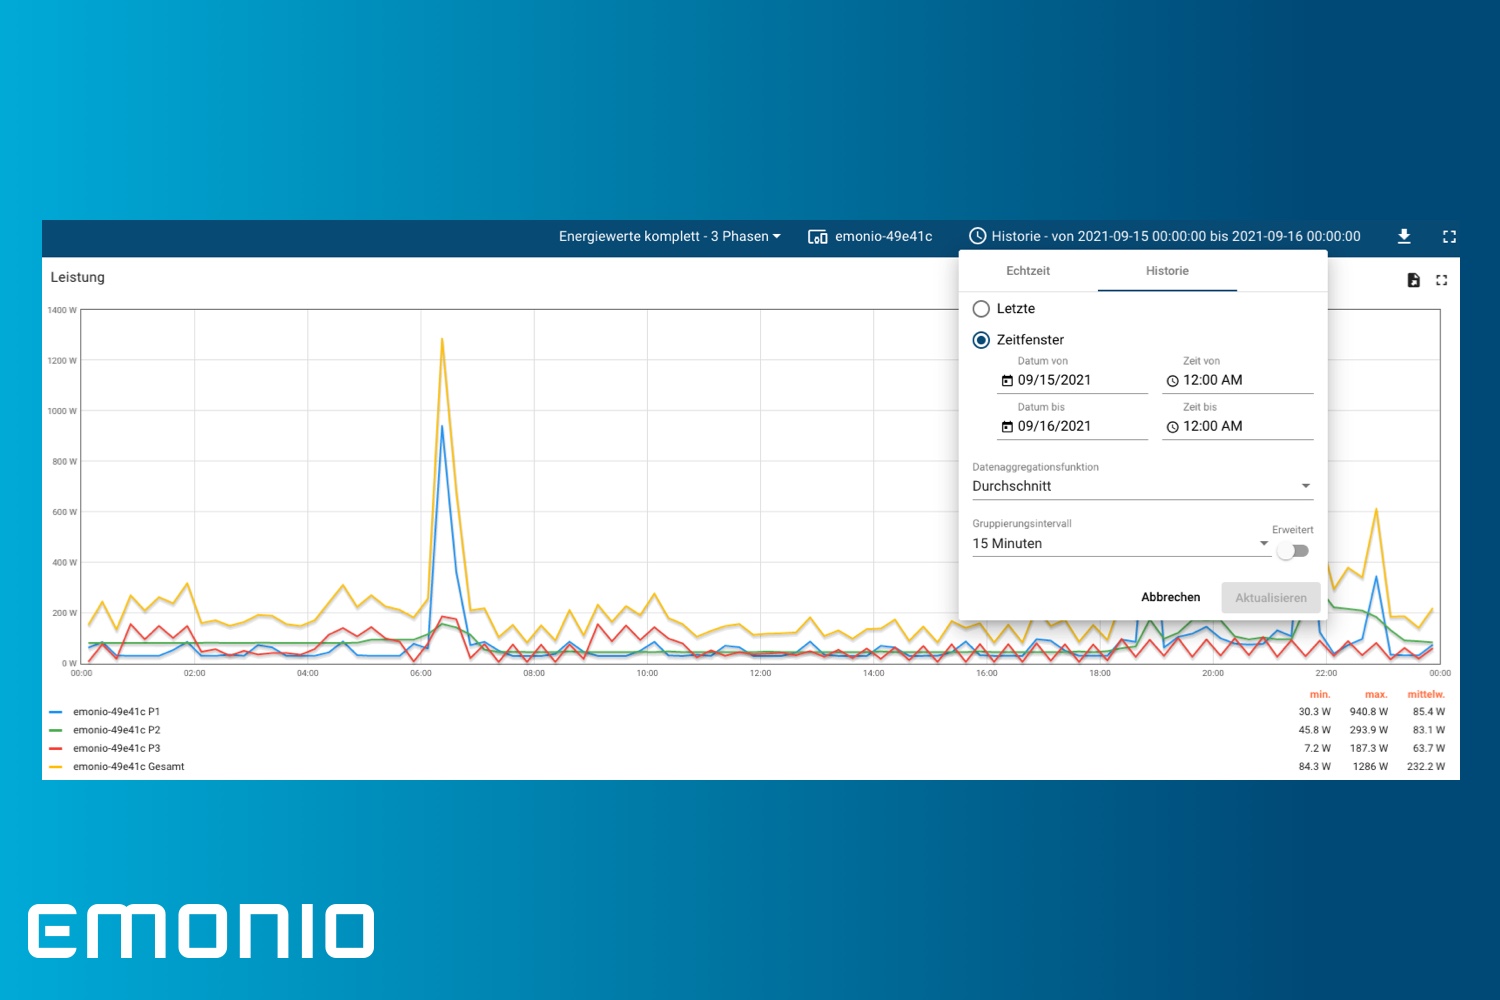
5/5 Select time slot

Track your load profile in real time or select a historical observation period.